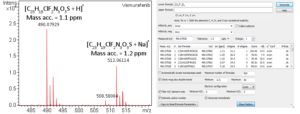
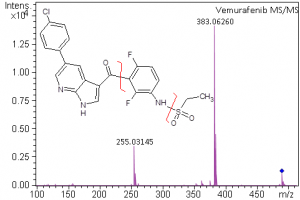
Small Molecule Characterization/Validation
High-resolution mass spectrometry can be used to determine the molecular formula of new chemical entities. When synthesizing compounds or characterizing natural products, metabolites or other new compounds a high-resolution, accurate mass spectrum can be used to determine the compound’s chemical formula. High-resolution mass spectrometry and NMR are key steps in publishing new chemical structures. At the AIC MS-Facility we have two, high-resolution mass spectrometers, a Bruker MaXis time-of-flight spectrometer and a Thermo Q-Exactive Orbitrap spectrometer. Both of these instruments are capable of mass measurements with sub-ppm mass accuracy and broadband resolution (FWHM) >60,000. This is sufficient for assigning formulae for most compounds up to ~500 Da. These spectrometers are also capable of MS/MS for structural analysis for further structural validations.
Small Molecule Quantitation
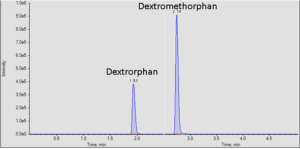
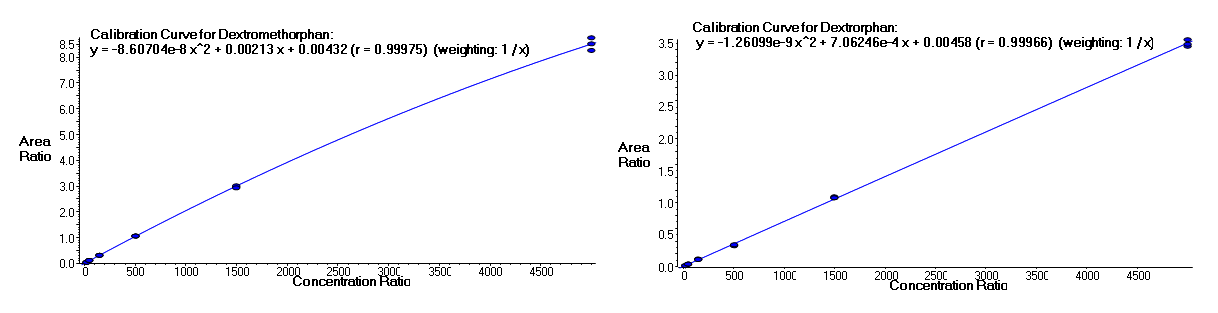
It is often important to determine how much of a drug, a metabolite or an endogenous component is present in a sample. Coupling liquid chromatography to mass spectrometry provides a robust approach to quantitation, particularly for substances lacking good chromophores. The AIC-MS Facility has two systems that can be used for quantitation. Our Waters Acquity UPLC system can be coupled to our AB/Sciex Q-Trap 5500 for traditional triple quadrupole quantitation. An alternative is to use our Dionex RSLC system coupled to our Q-Exactive Orbitrap spectrometer for high-resolution analysis. Both systems can be used for traditional area-under-the-curve quantitation. In these assays both experimental samples and calibration samples are processed with an internal standard and a calibration curve of the analyte relative to the internal standard is fitted and used to determine the levels of analyte in the experimental samples. Quantitation of this type is particularly useful in pharmacokinetics and pharmacodynamics (PKPD), medicinal chemistry structural optimizations, adsorption, distribution, metabolism and excretion (ADME) analysis and looking at effects of various treatments on levels of endogenous small molecules.
Protein/Large Molecule Characterization & Validation
Mass spectrometry can also be used to characterize larger molecules. High-resolution MS can be used to interrogate intact proteins and other large molecules, so-called “Top-Down” MS. In the AIC the Bruker MaXis time-of-flight spectrometer can be used to look at purified proteins in the mass range of 65,000 Da. This will tell us if the theoretical and observed masses match. Differences from the theoretical can indicate different types of modifications. Exact locations of modifications can frequently be elucidated by digesting proteins with trypsin and using liquid chromatography-tandem MS (isolation and fragmentation of a peptide then measuring the mass of the fragments). This LC/MS/MS can also be used to identify unknown proteins that researchers may find in co-immunopreciptations or other experiments. We recently used LC/MS/MS to validate the identity of overexpressed, recombinant proteins that were being used in clinical vaccine trials for a client of the Waisman Biomanufacturing Facility.
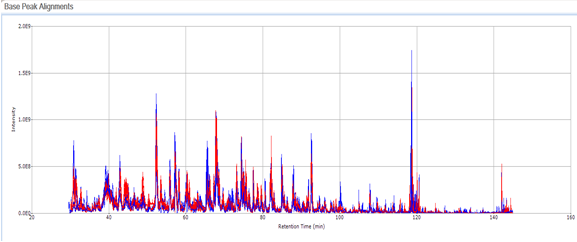
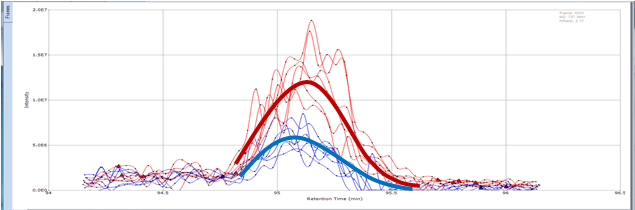
Protein/Proteomic Quantitation
It is often important to understand how cells or organisms respond to drugs, or environmental changes. Frequently the complement of cellular proteins will change in response to these perturbations. Understanding these changes can provide insight into the mechanistic details of the response. In the AIC-MS Facility we can use relative proteomic quantitation by liquid chromatography-tandem mass spectrometry (LC/MS/MS) to evaluate global changes in response to drugs or other treatments. We prepare protein extracts from treated and untreated conditions, digest the proteins with trypsin and run replicate LC/MS/MS analysis on our nAcquity/Q-Exactive. We then use the SIEVE software package to identify peptides observed in the run, and perform a statistical comparison of the area-under-the-curve. An extracted ion chromatogram of each observed peptide is constructed and the relative areas in treated and control samples are compared. Ultimately this analysis provides a list of identified proteins and their relative fold-changes in the two (or more) conditions. These lists of identified proteins with their regulatory changes can then be further analyzed for common enzymatic or regulatory pathways.